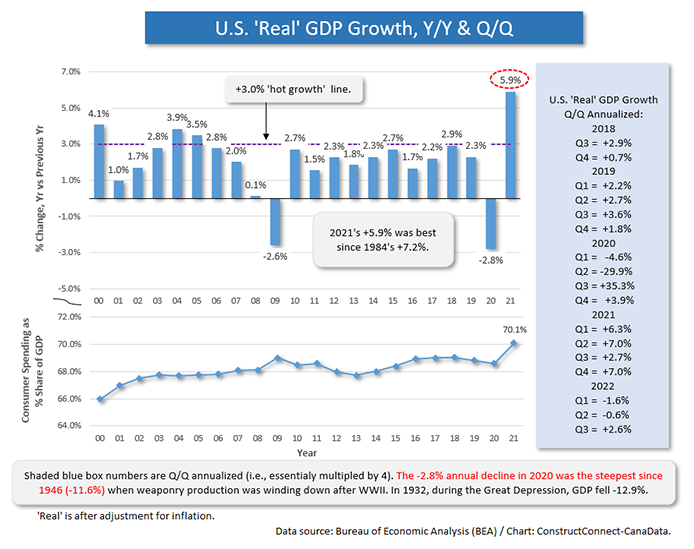
After a gloomy patch in late summer and early fall, dominated by discussion of inflation and recession, the economic and construction news is beginning to lighten a bit. The first ray of sunshine has come in the 2022 third quarter ‘advance estimate’ GDP report. Rather than retreating or standing still, Q3 ‘real’ gross domestic product advanced by +2.6% seasonally adjusted and annualized, improving nicely on the -0.6% and -1.6% performances of Q2 and Q1 respectively.
 It’s also interesting to note the BEA’s upbeat revisions to the 2021 and 2020 year-over-year annual results. 2021’s gain was moved up a little to +5.9% from an earlier estimated +5.7% and 2020’s decline was reduced to -2.8%, as opposed to -3.4%. The -2.8% showing in 2020 was a remarkable achievement, given the coronavirus-generated chaos in the first half of the year. According to the revised estimate of GDP change in 2020 (at -2.8% y/y), it wasn’t much worse than the -2.6% that occurred in 2009 (see Graph 1).
Q3 2022’s GDP strength was concentrated in consumer expenditures on services (especially health care) and in exports of goods (petroleum products). Acting as a drag on GDP’s forward motion, though, was investment in residential structures, with particular weakness in the new single-family home market.
The higher interest rate regime being set in place by the Federal Reserve is having a cooling effect on homebuying demand. Mortgage rates that have climbed as high as 7.00% for the first time in two decades have rendered the household budgeting plans for many prospective buyers obsolete and no longer viable.
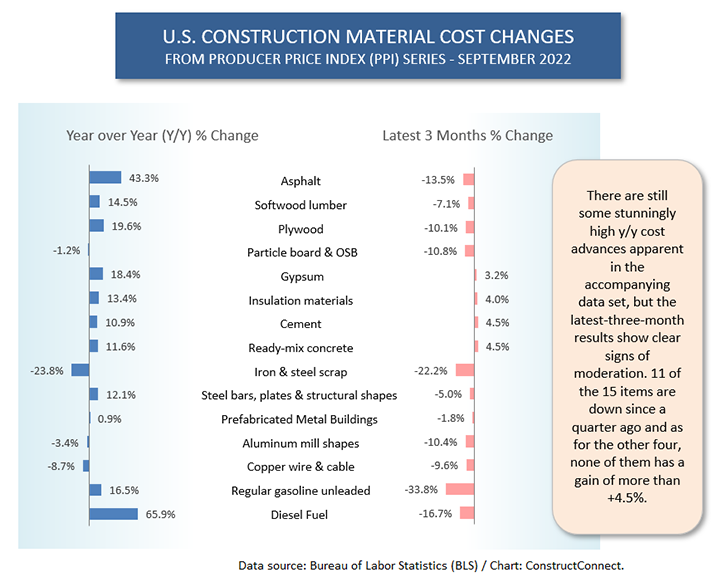
This is leading to a not unwelcome side effect. At times, during the past year or so, construction material and other input costs have soared like never before. Finally, as is apparent from Graph 2, a softening is emerging. While many year-over-year price movements remain extremely elevated, the adjustments over the latest three months have shown an opposite tendency. For the 15 items in Graph 2, 11 have prices that have shifted lower over the latest quarter. The price movements are as captured by the Producer Price Index (PPI) data set calculated monthly by the Bureau of Labor Statistics (BLS).
Nor are the downward adjustments confined to the residential construction field. There’s been easing in the prices of steel, aluminum, and copper in their various forms, which takes the pressure off how expensive building materials made of those products have to be to turn a profit for manufacturers.
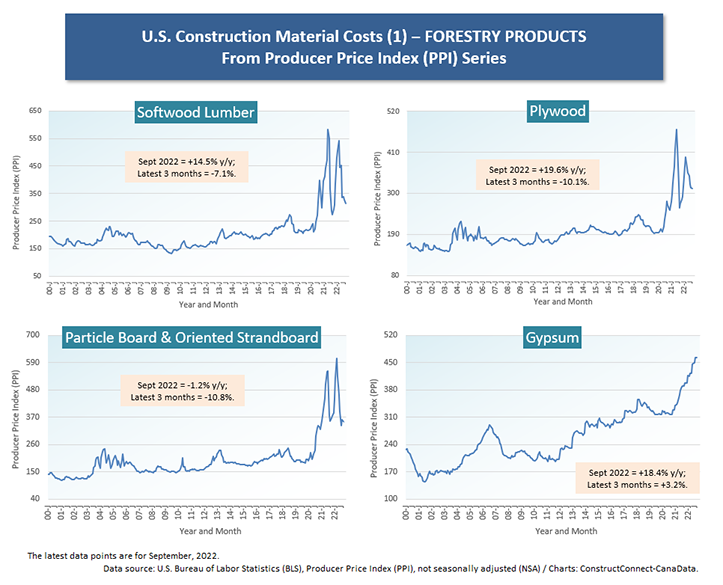
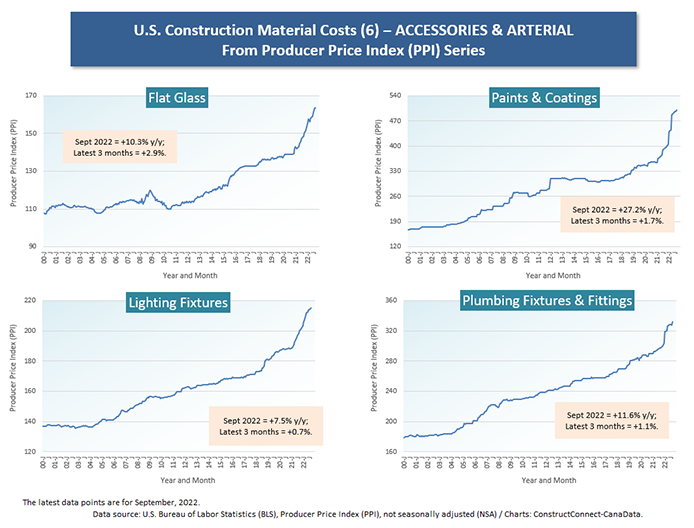
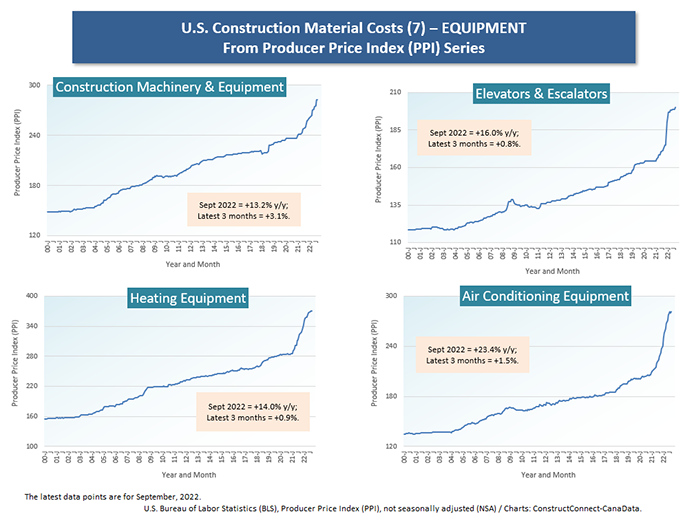
Many of the curves in the cluster charts from 1 to 7 have recently descended significantly or have leveled off. In the latter instances, however, it must be acknowledged that the price levels do remain lofty in a historical context. This is true for gypsum, cement, ready-mix concrete, insulation materials, flat glass, and paints and coatings. The equipment cost indices (Cluster Chart 7) continue to be notably high.
The overall easing in construction material and other input costs, however, is most readily revealed in Graph 3. The average of the two pertinent PPI composite material price indices has dropped from an extreme of +30% year over year in June 2021 to ‘just’ +8.8% in September of this year. Meanwhile, contractors have been able to move their ‘final demand’ or bid prices up considerably, from near 0% in early 2021, to where they are now +23.1% year over year.
There are a couple of final points to mention with respect to the economy. Among the world’s industrialized nations, the Bank of Canada has been a leader among central banks in adopting a hawkish stance on interest rates. The BoC recently stiffened its key overnight rate by another degree, settling on 3.75%. But the basis-point increase this time was +50 rather than +75. Some investors are interpreting the slight scaling back of aggressive action to be a sign that economic matters are working out as planned ̶ i.e., that there’s been a gradual slowing of the economy that has helped relieve pressure points tied to supply blockages and price runups ̶ and that not a great deal more monetary intervention may be needed.
Also, some of the world’s heaviest thinkers (e.g., Jamie Dimon of JPMorgan Chase and others), when asked what they view as being the biggest threats to the economic outlook, have shifted their gaze away from inflation and recession to geopolitical concerns, chief among them being the continuing conflict in Ukraine (which is still roiling energy and food product markets), President Xi’s ascendancy to total control in China (threatening further harsh words with the U.S. over Taiwan and the South China Sea) and various developments in the Middle East (i.e., a social uprising in Iran and a less accommodating administration in Saudi Arabia).
Graph 1
Graph 2
Cluster Chart 1
Cluster Chart 2
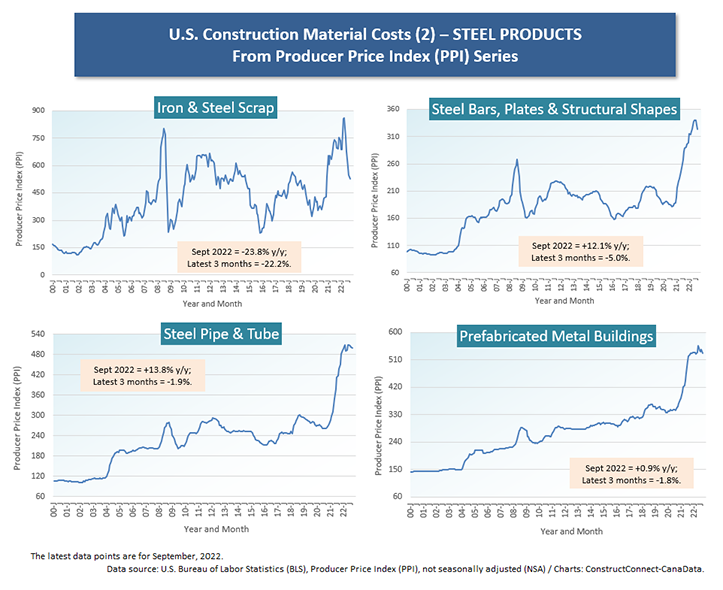
Cluster Chart 3
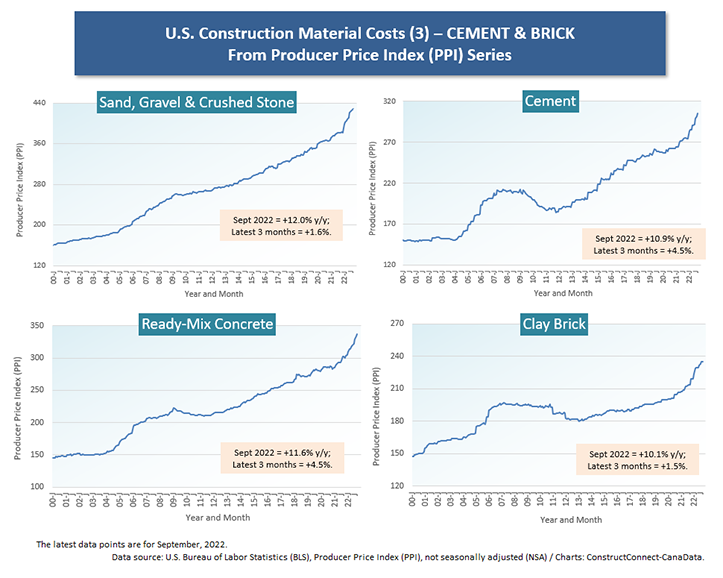
Cluster Chart 4
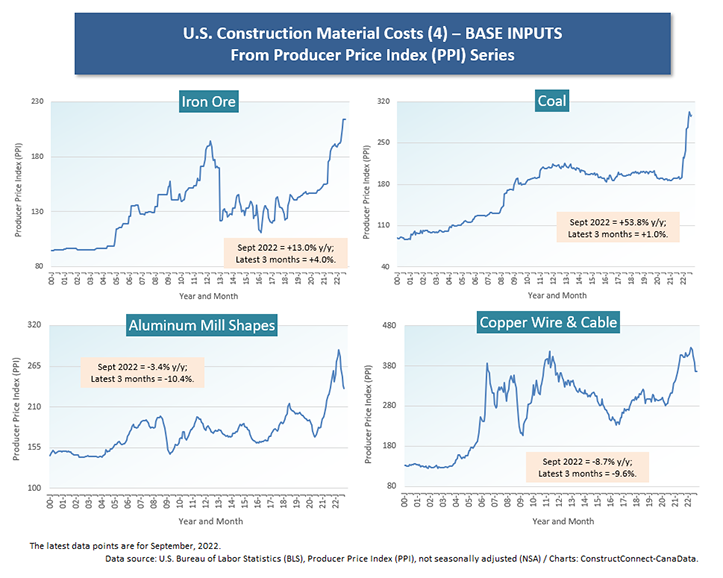
Cluster Chart 5
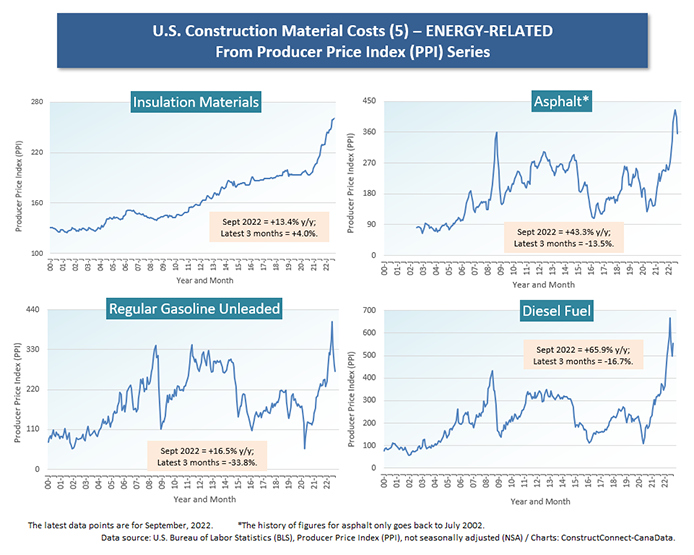
Cluster Chart 6
Cluster Chart 7
Graph 3
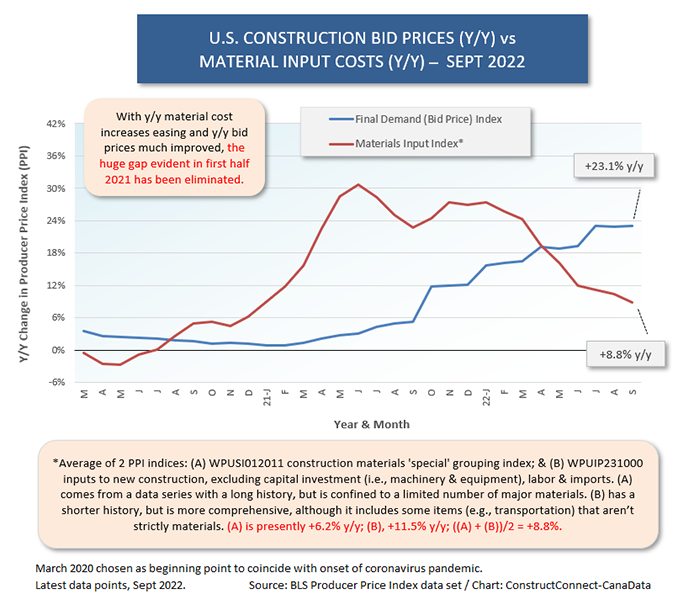
Table 1

Alex Carrick is Chief Economist for °µÍø½ûÇøConnect. He has delivered presentations throughout North America on the U.S., Canadian and world construction outlooks. Mr. Carrick has been with the company since 1985. Links to his numerous articles are featured on TwitterÌý, which has 50,000 followers.



Recent Comments
comments for this post are closed