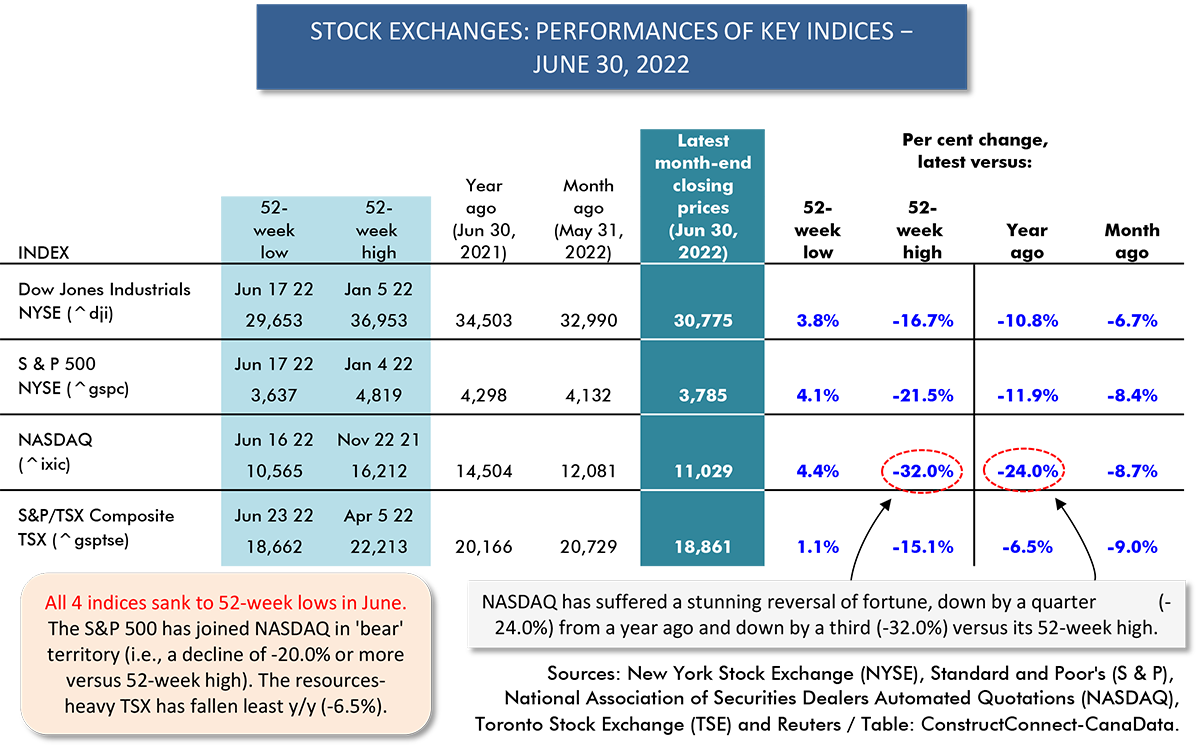
In stock market parlance, a ‘bear’ market refers to a decline from recent peak of -20% or more.
In the past 52 weeks, the high-to-low changes for the NASDAQ and S&P 500 indices have been -34.8% and -24.5% respectively, sending them to live with the occupants of the quaint cottage in the woods once visited by Goldilocks.
 The DJI has narrowly escaped such a fate, so far, by registering a drop from 52-week high to 52-week low of -19.8%. The TSE’s comparable change has been a more restrained -16.0%.
Even during some of the worst early days of the pandemic, business confidence was lifted by the ‘animal spirits’ being shown in the stock market.
There was no letup in the enthusiasm expressed for equities in the high-tech sector. Month after month, the NASDAQ index soared to new all-time highs. There were occasional setbacks, but they were few and far between.
Headlining the spectacular show was the FAAMG group of companies, comprised of Facebook (now Meta), Apple, Amazon, Microsoft, and Google (now Alphabet).
Those days are gone, and it will be interesting to see if their like ever arise again. It seems doubtful.
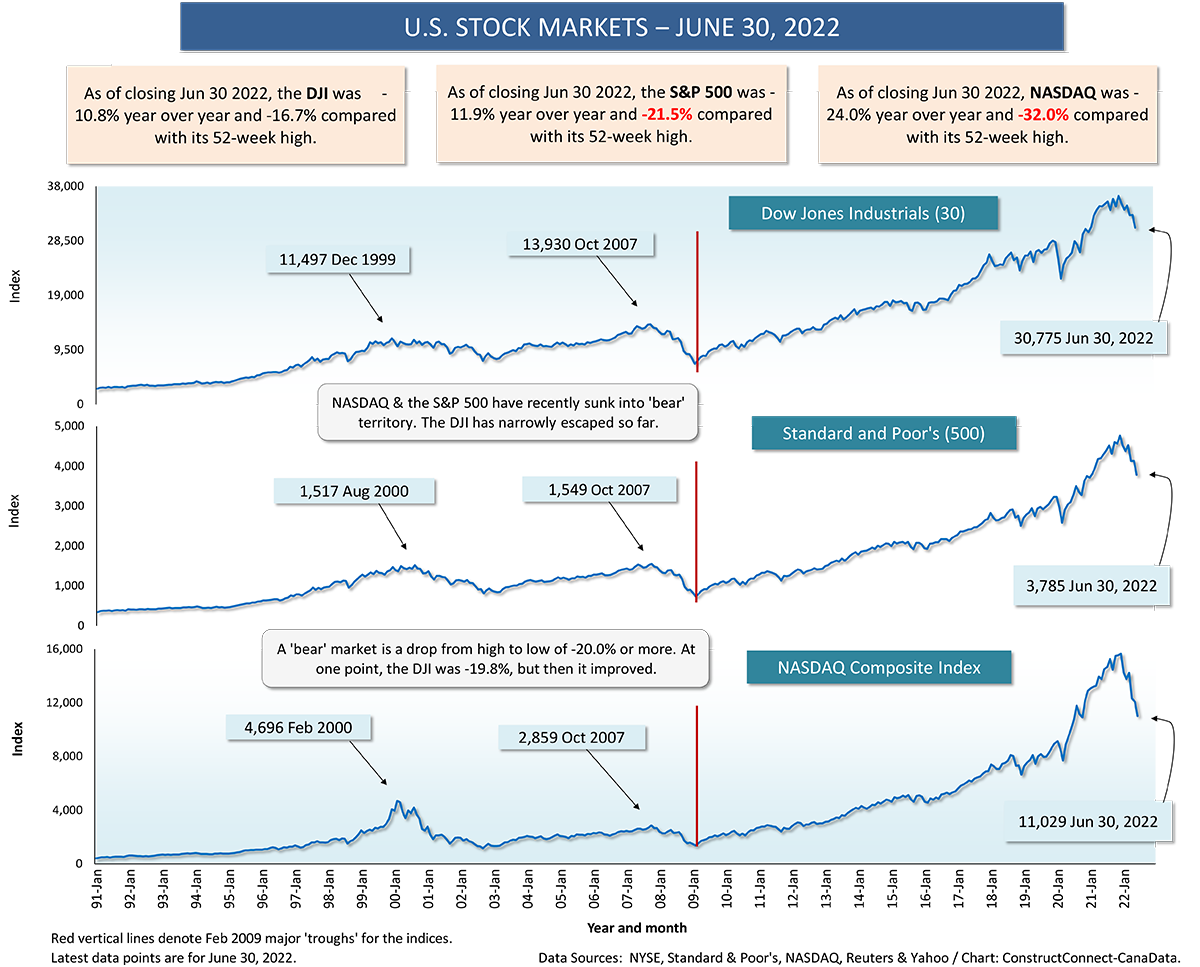
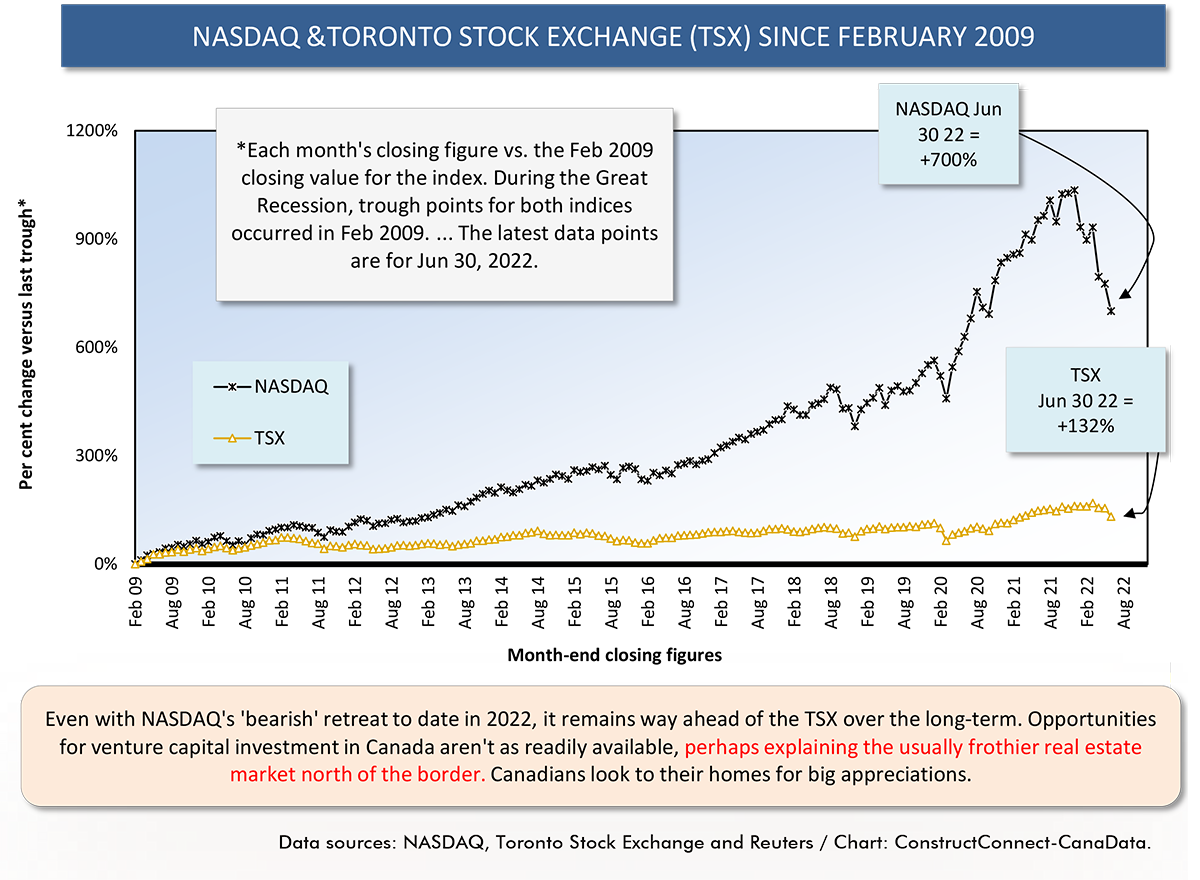
Not so long ago, in December 2021, the NASDAQ index was up +1,000% relative to its trough level in February 2009. Now, it has retreated to a position that’s +700% compared with 13 years ago. That’s still an exceptional performance, but it falls short of the champagne-popping days, which were only half a year ago.
It was the FAAMG group of companies that were in the forefront when NASDAQ was enjoying its upwards charge. Some of those firms, however, have fallen markedly out of favor with equity investors this year.
Two of the more prominent reasons include some well-noted failures to meet sales and sign-up targets and the prospect of more overt restraint to be imposed by regulators. The latter stems from concerns over the nearly total market dominance being enjoyed by some tech giants and, in the social media area, from conflicts over how much freedom of expression should be allowed.
The numbers showcased in Graph 2 don’t always capture the hard times experienced by some of the FAAMG companies in the past year. For example, Apple may presently be +0.4% year over year, but within the past 52 weeks, its high-to-low movement has been -28.2%.
Microsoft may currently be -4.4% y/y, but its high-to-low movement within the past 52 weeks has been -30.0%.
Alphabet may currently be -10.8% y/y, but its high-to-low movement within the past 52 weeks has been -30.4%.
Amazon and Facebook have struggled the most. The high-to-low downshifts in their equity values during the latest 12 months have been -46.0% and -58.0% respectively. And they currently remain in deep funks year over year, -38.3% and -53.6% respectively.
None of the foregoing share price drops, however, compare with what the non-FAAMG company, but famous tech torchbearer nonetheless, Netflix, has experienced. NFLX has been encumbered with a latest 52-week high-to-low plummet of -76.6% and a y/y decline of -66.9%.
It’s not outrageous to say that NASDAQ and its high-tech listings, in most of this century until the end of 2021, have been sucking the air out of the room when the subject of stock market investing has come up. Maybe it’s not so bad that a respite has finally materialized.
It may be time to pay more attention to the resource sector companies and industrial concerns that can account for the mega-sized development projects that have often driven nonresidential construction activity in the past.
��
Table 1
Graph 1
Graph 2
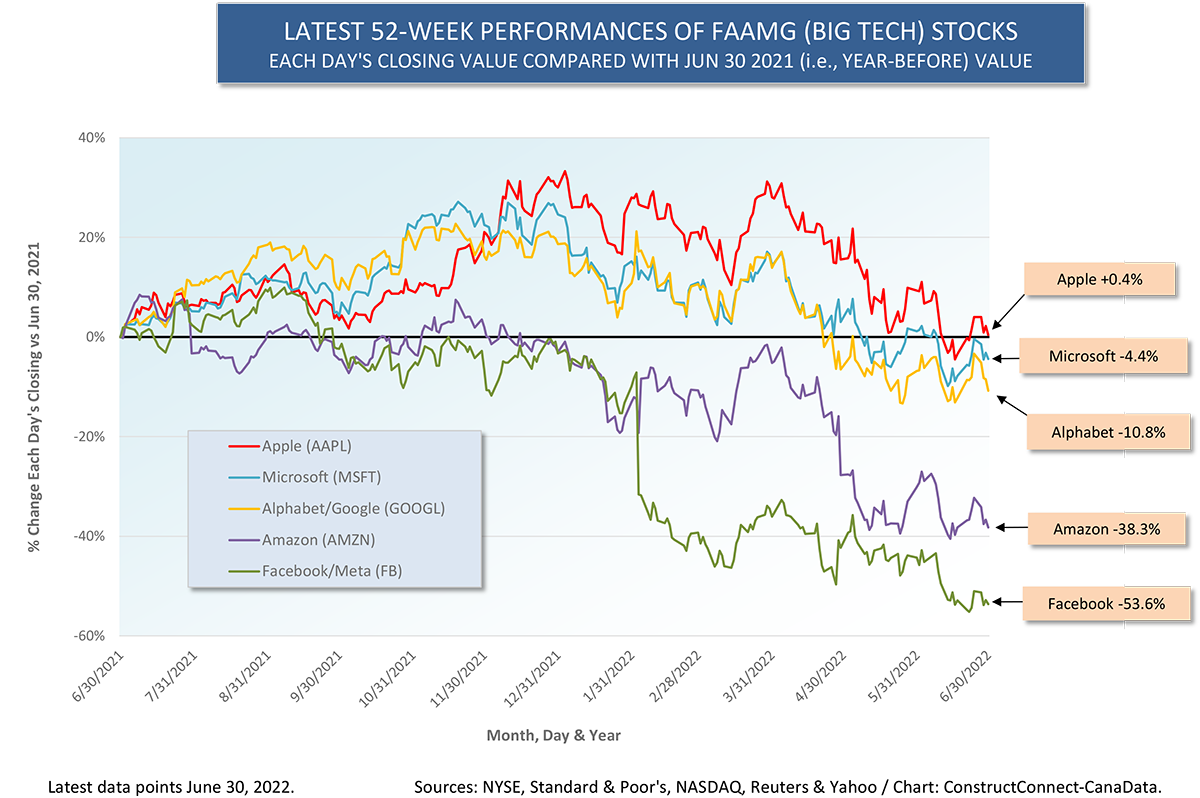
Table 2
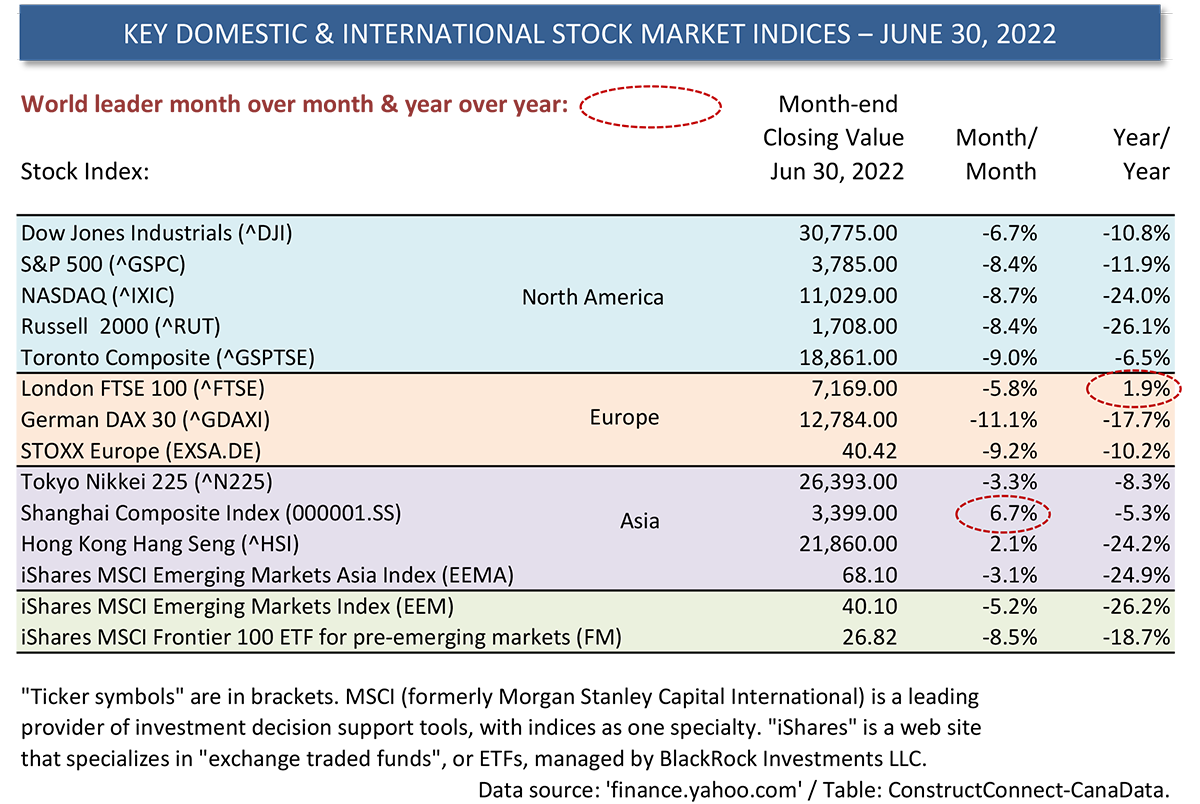
Graph 3
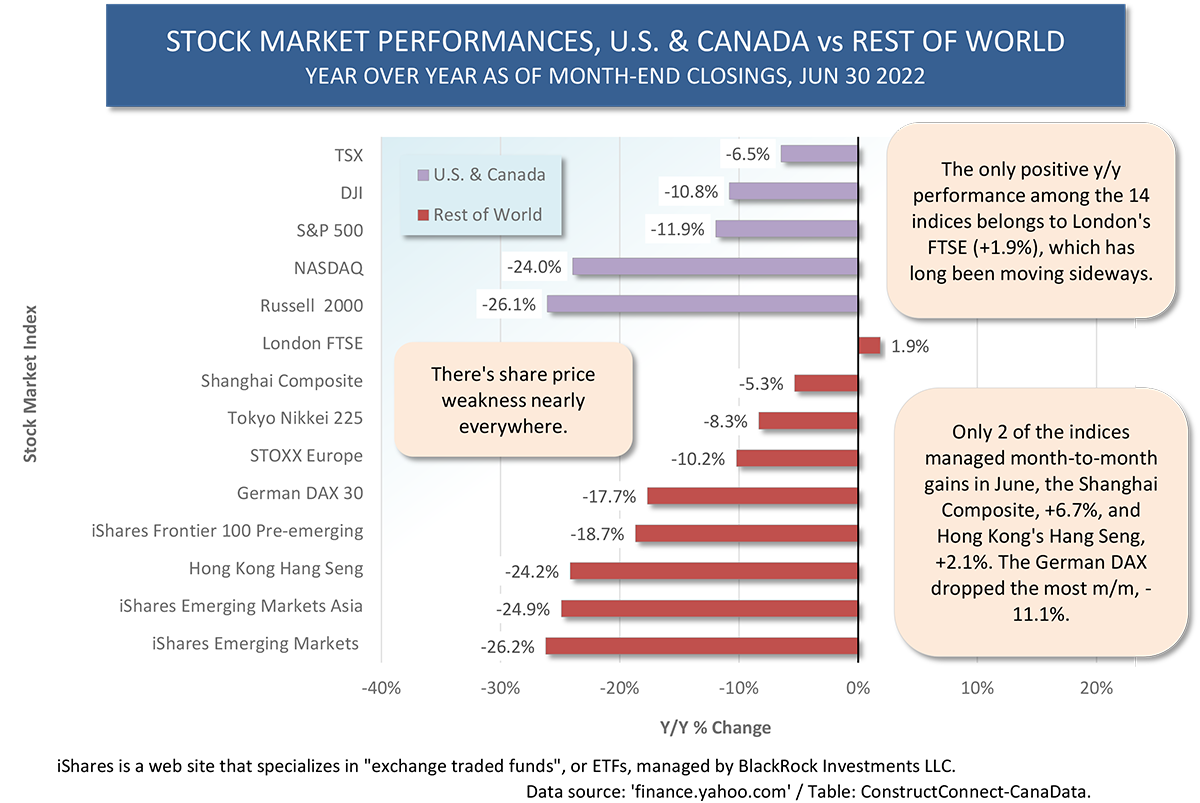
Graph 4
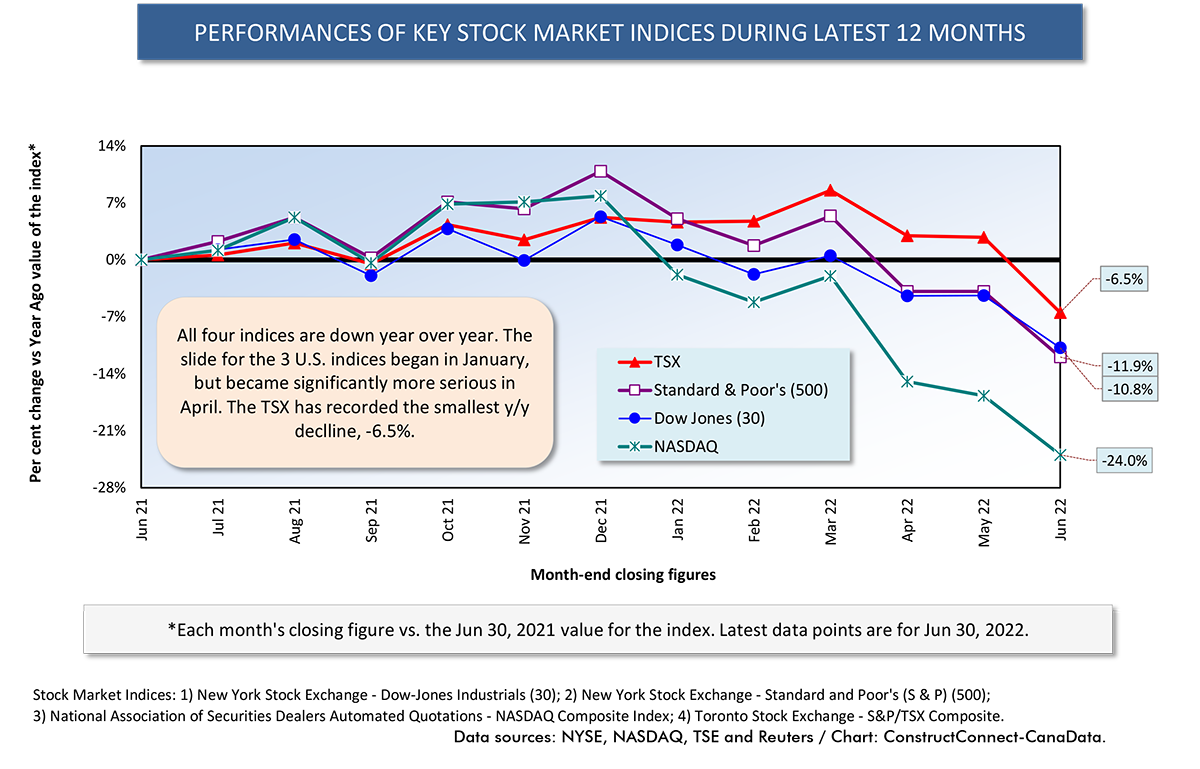
Graph 5
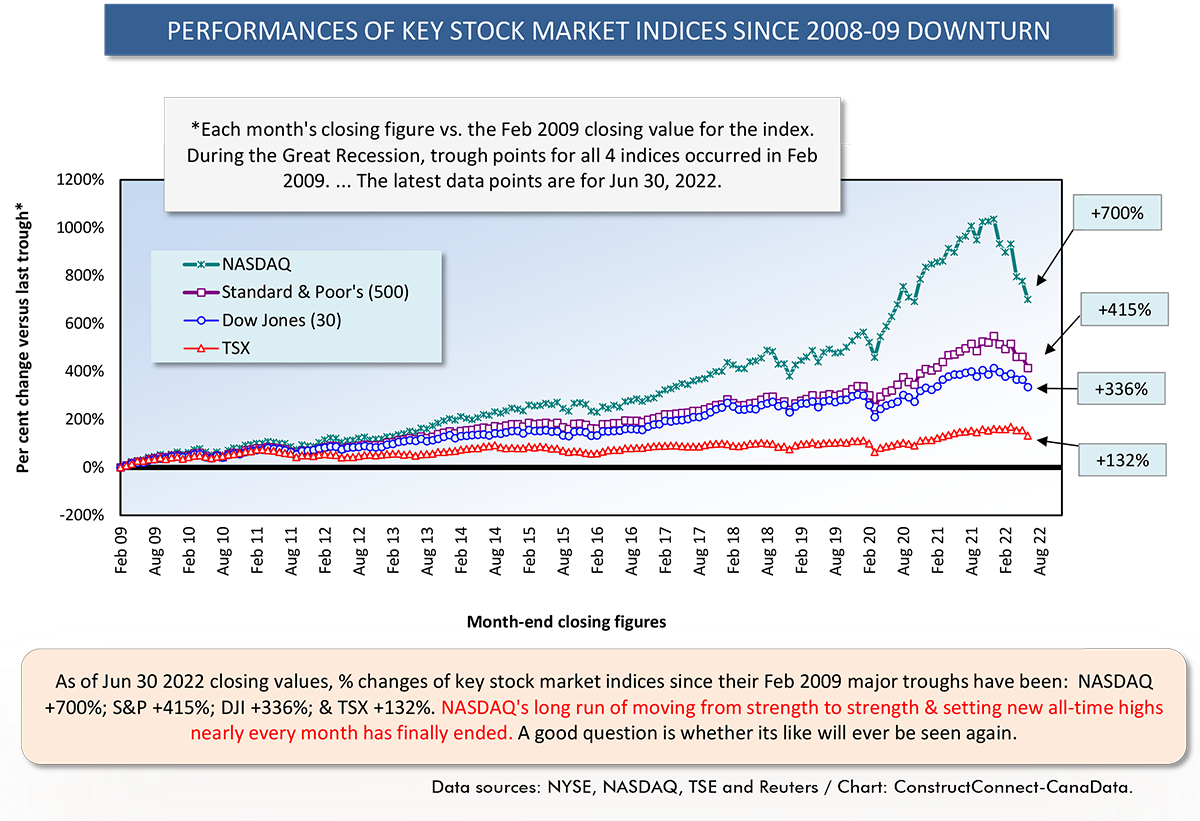
Graph 6
Alex Carrick is Chief Economist for ��������Connect. He has delivered presentations throughout North America on the U.S., Canadian and world construction outlooks. Mr. Carrick has been with the company since 1985. Links to his numerous articles are featured on Twitter��, which has 50,000 followers.


Recent Comments
comments for this post are closed