February was another great month for jobs creation in the United States. According to the Bureau of Labor Statistics (BLS), as set out in the latest report, the total number of positions nationwide rose by +678,000.
 The construction industry made a significant contribution to that two-thirds-of-a-million jobs gain through net hiring of +60,000 jobs. Most of the +60,000 increase was at the sub-trade level, with residential specialty contractors upping their staffing by +24,000 jobs and non-residential specialty contractors taking on an additional +20,000 employees.
The seasonally adjusted (SA) national unemployment rate (often referred to as the ‘headline’ rate) in February tightened to 3.8% from 4.0% in January. The not seasonally adjusted (NSA) unemployment rate decreased to 4.1% in the latest month from 4.4% in the previous month.
��������ion’s NSA U rate contracted to 6.7% in February from 7.1% in January. In February 2020, the percentage of construction workers shunted to the sidelines had been 9.6%.
Graph 1
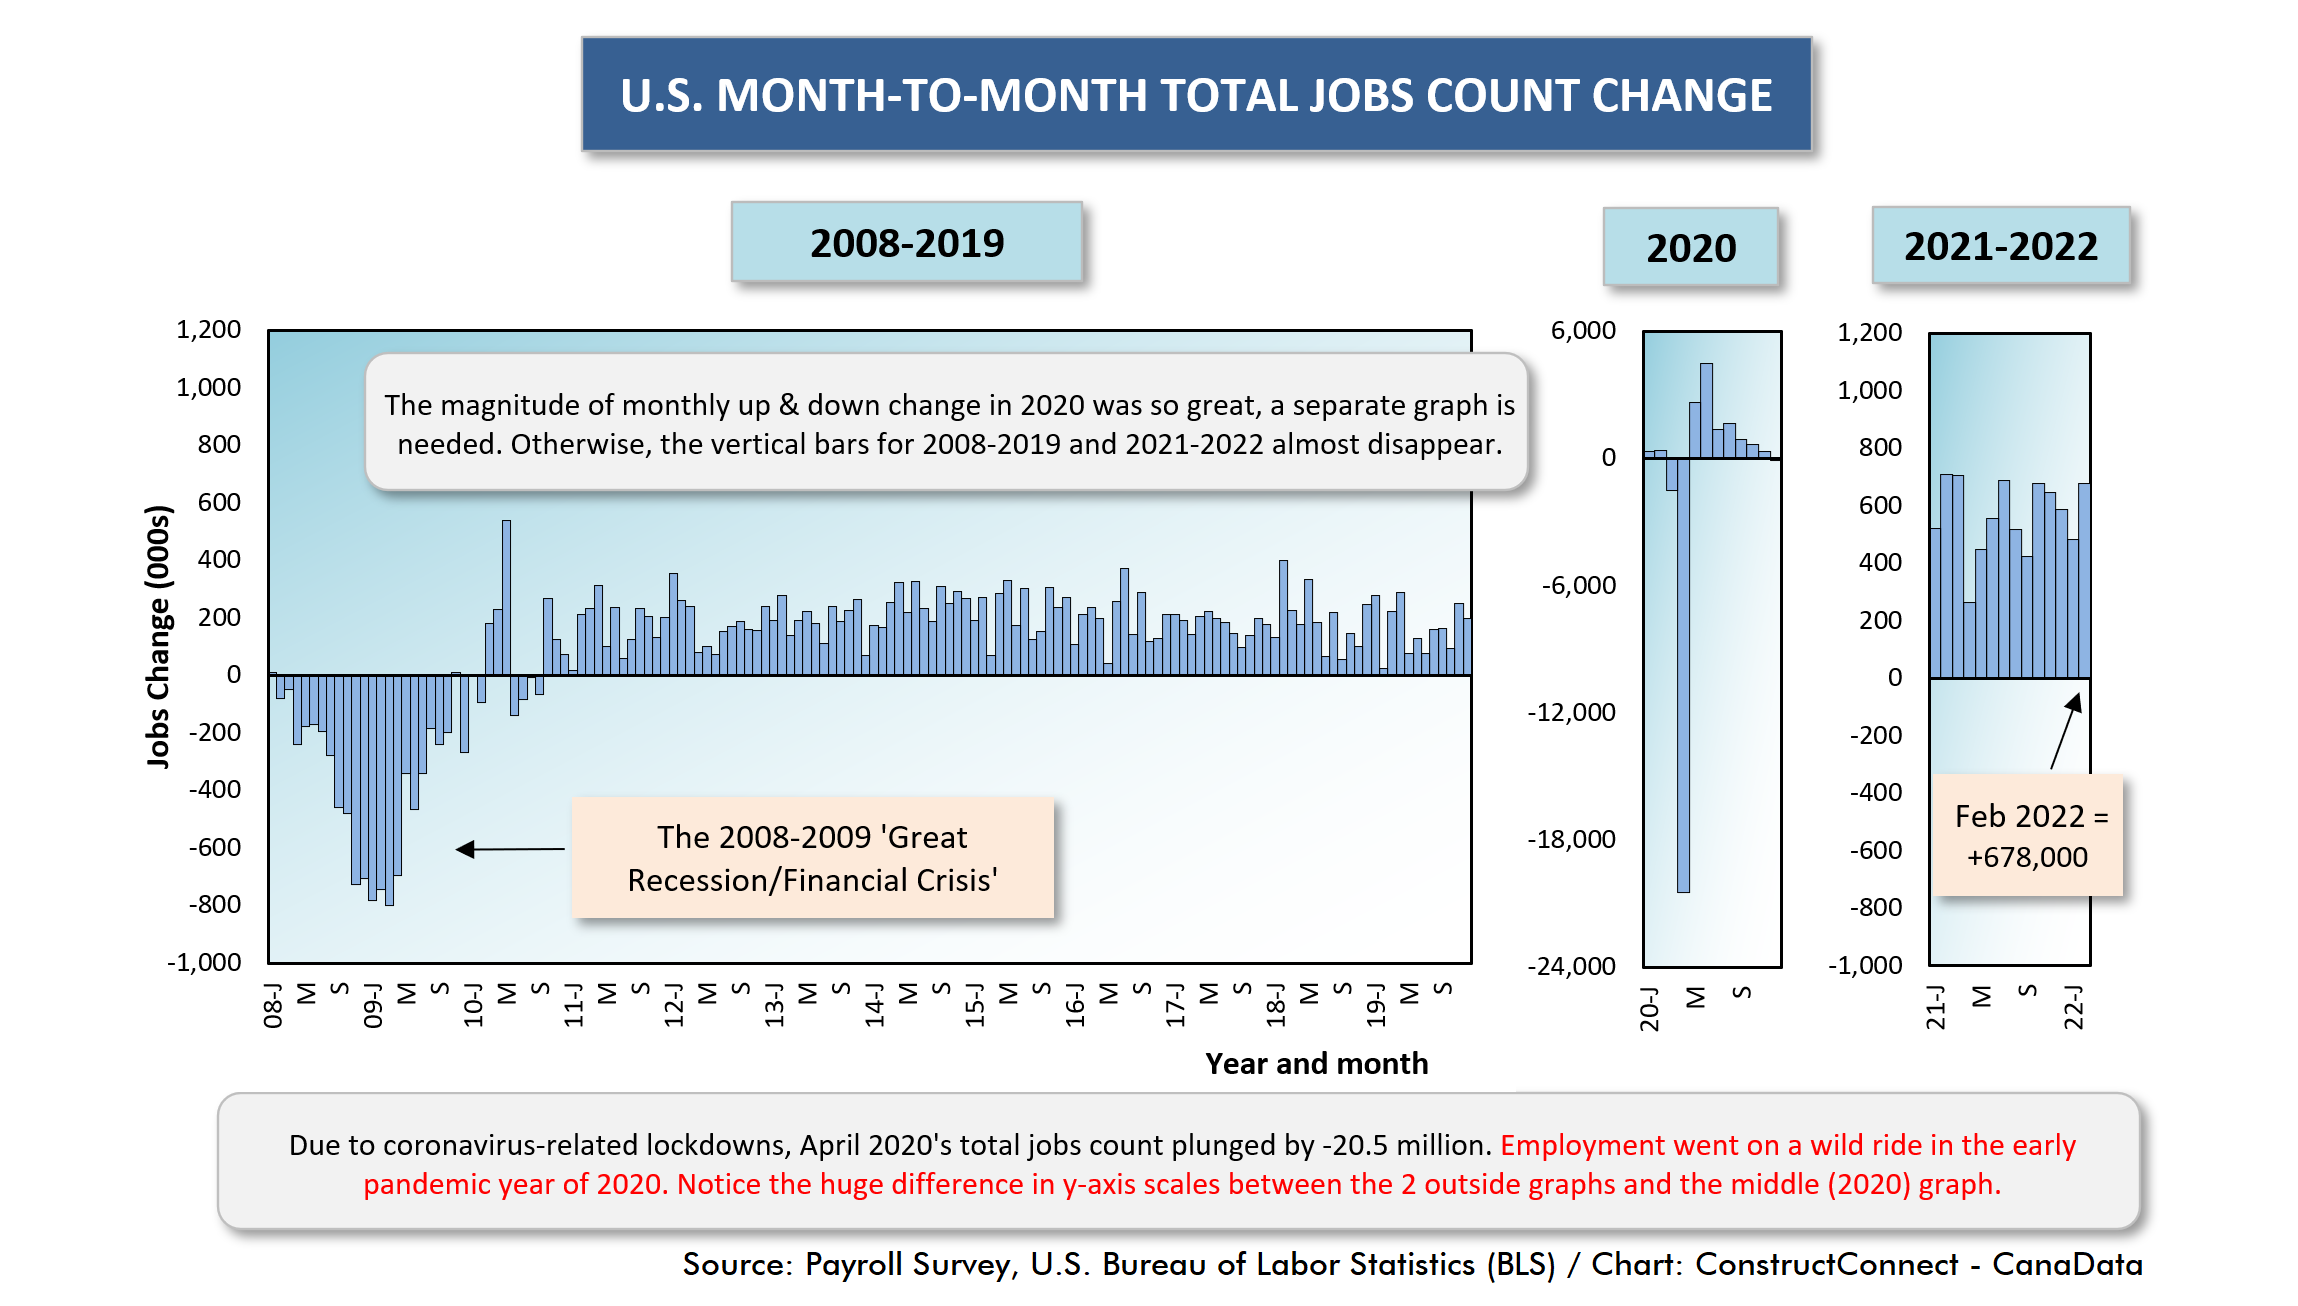
Graph 2

Big Wage Hikes
The most interesting results to be found in the latest Employment Situation report, however, concern compensation rates.
Table B-8 in the report from the BLS sets out hourly and weekly earnings for ‘production and nonsupervisory employees on nonfarm payrolls’. That’s a long way of saying its numbers are exclusive of ‘bosses’.
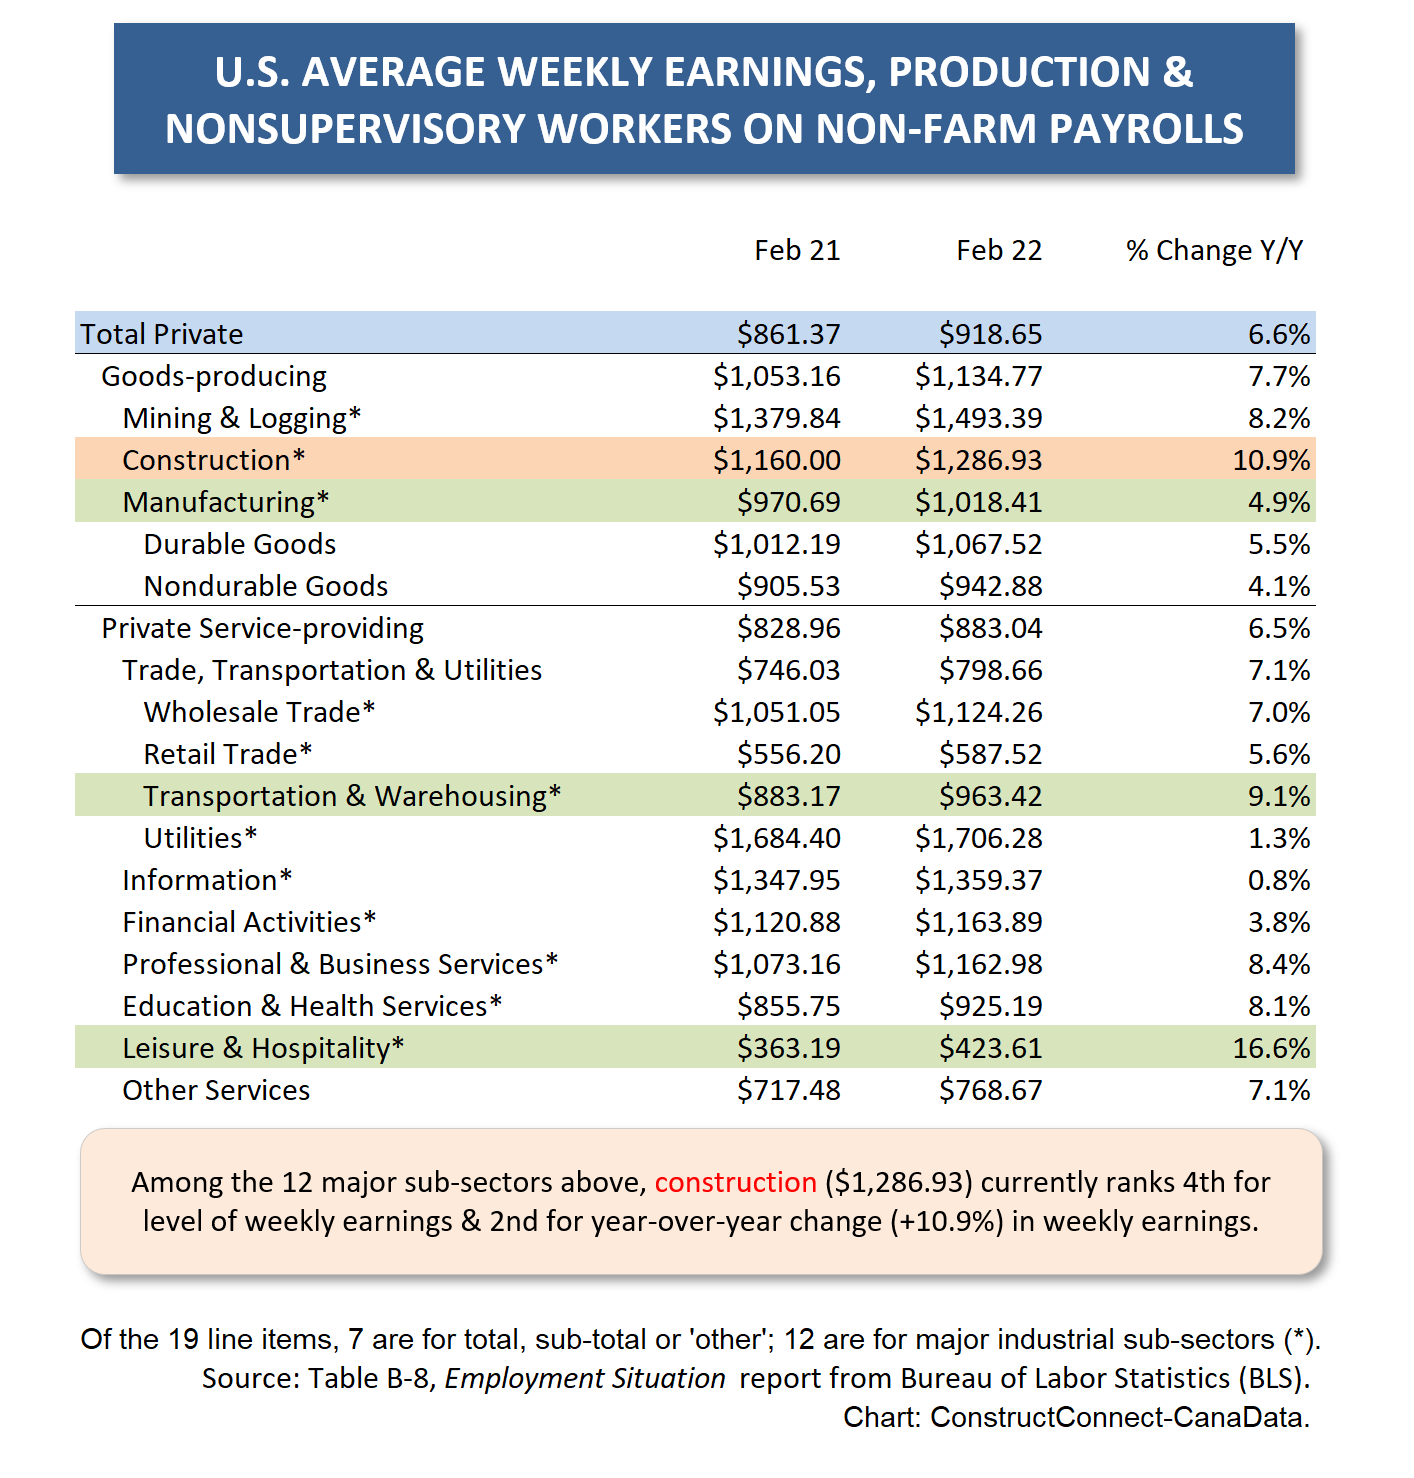
Tables 1 and 2 below show non-boss hourly and weekly earnings for ‘all jobs’ in the economy and for all major industrial sectors.
While media attention lately has been focused on inflation and the +7.5% year over year increase in the Consumer Price Index (CPI), some big wage hikes have been occurring under the radar.
The steep earnings jumps have been a relatively recent phenomenon. To a significant degree, they’ve been made necessary and are in reaction to the steep runup in prices generally.
But it’s also true they’ve been mandated by the difficulty some corners of the economy have been having in achieving hiring goals. This certainly applies for the contracting sector, where the number of openings has been vastly exceeding the number of new hires.
According to the latest compensation results, it can no longer be said that work in construction isn’t keeping up earnings-wise with other options.
Table 1 below records a +6.7% year-over-year hourly earnings gain for private sector non-boss jobs in the economy. ��������ion trailed slightly, but still managed an impressive bump of +6.0% y/y.
Table 2, though, sets out weekly earnings, and that’s where construction jobs made their showiest mark. Whereas the ‘all jobs’ earnings gain in Table 2 was +6.9% y/y, construction’s leap was +10.9%. ��������ion workers grabbed second spot for biggest y/y increase in hourly earnings, beaten only by leisure and hospitality workers, at +16.6% y/y.
Table 1
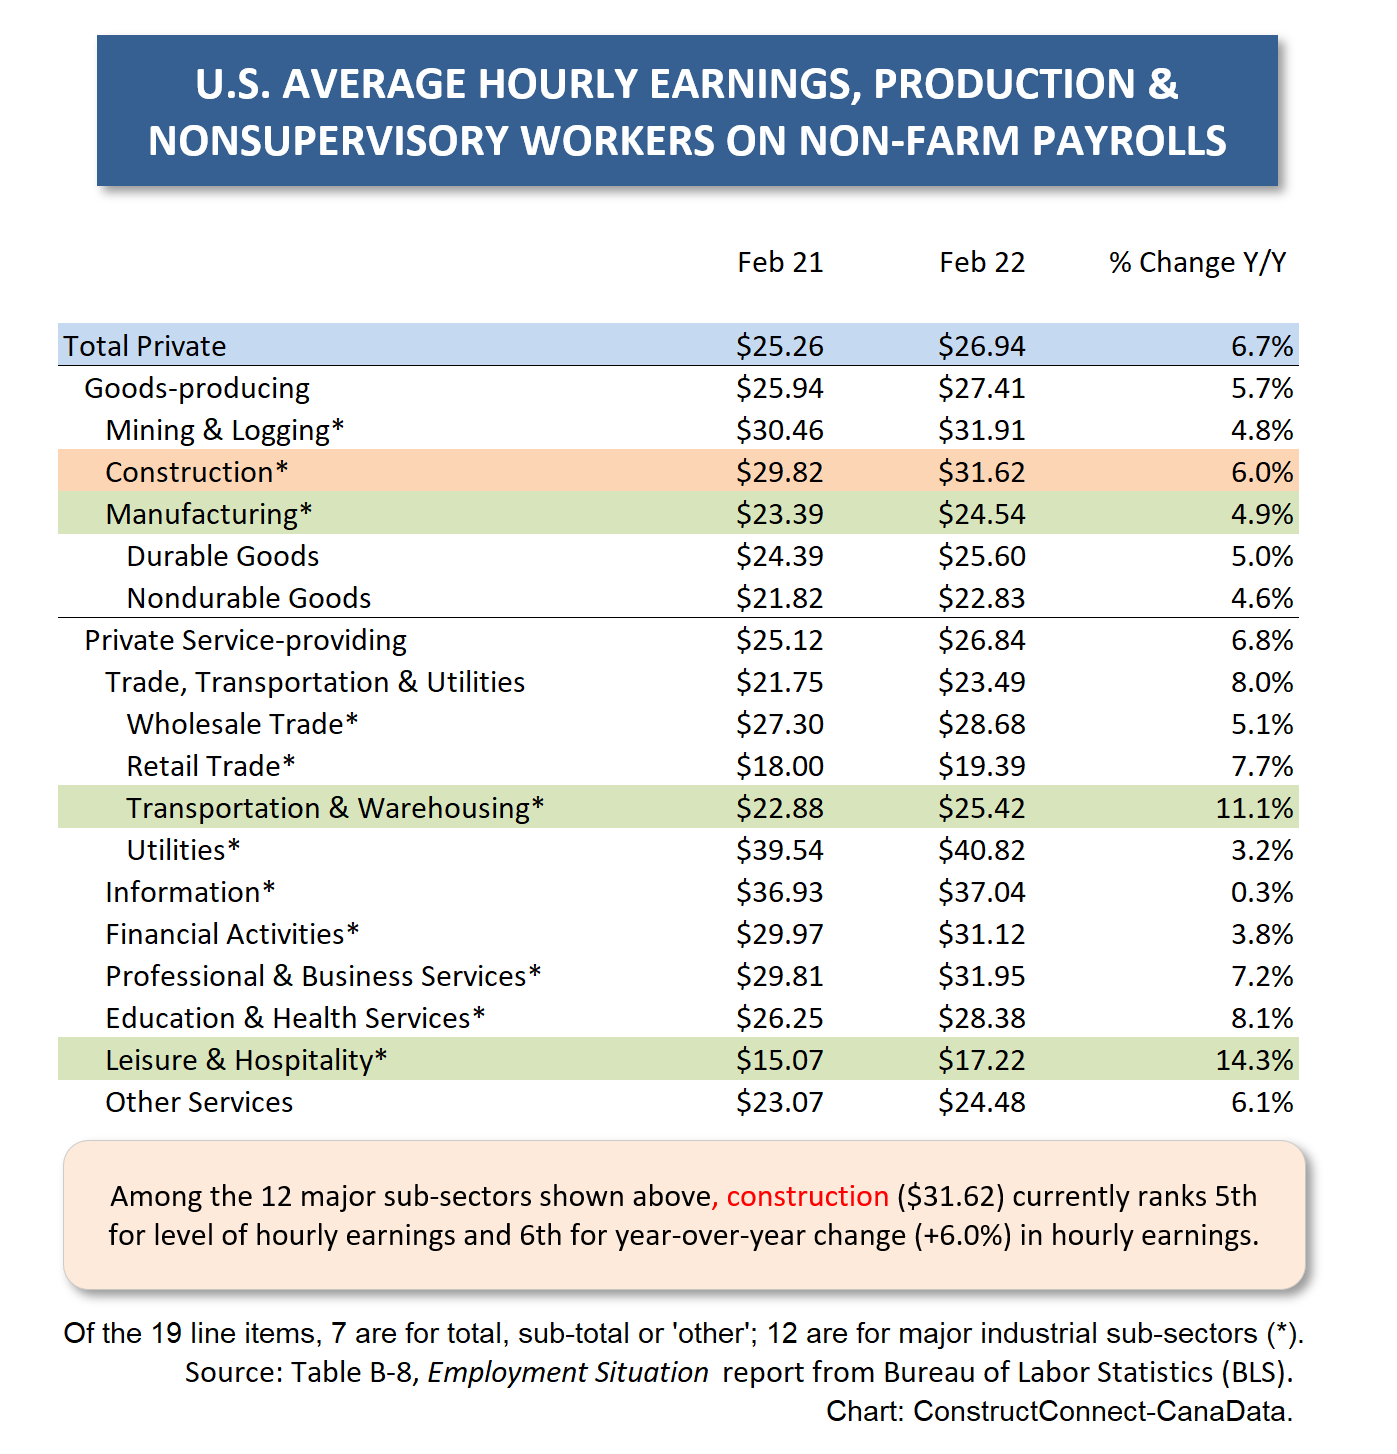
Table 2
Heartening Jobs Claw-back Ratios
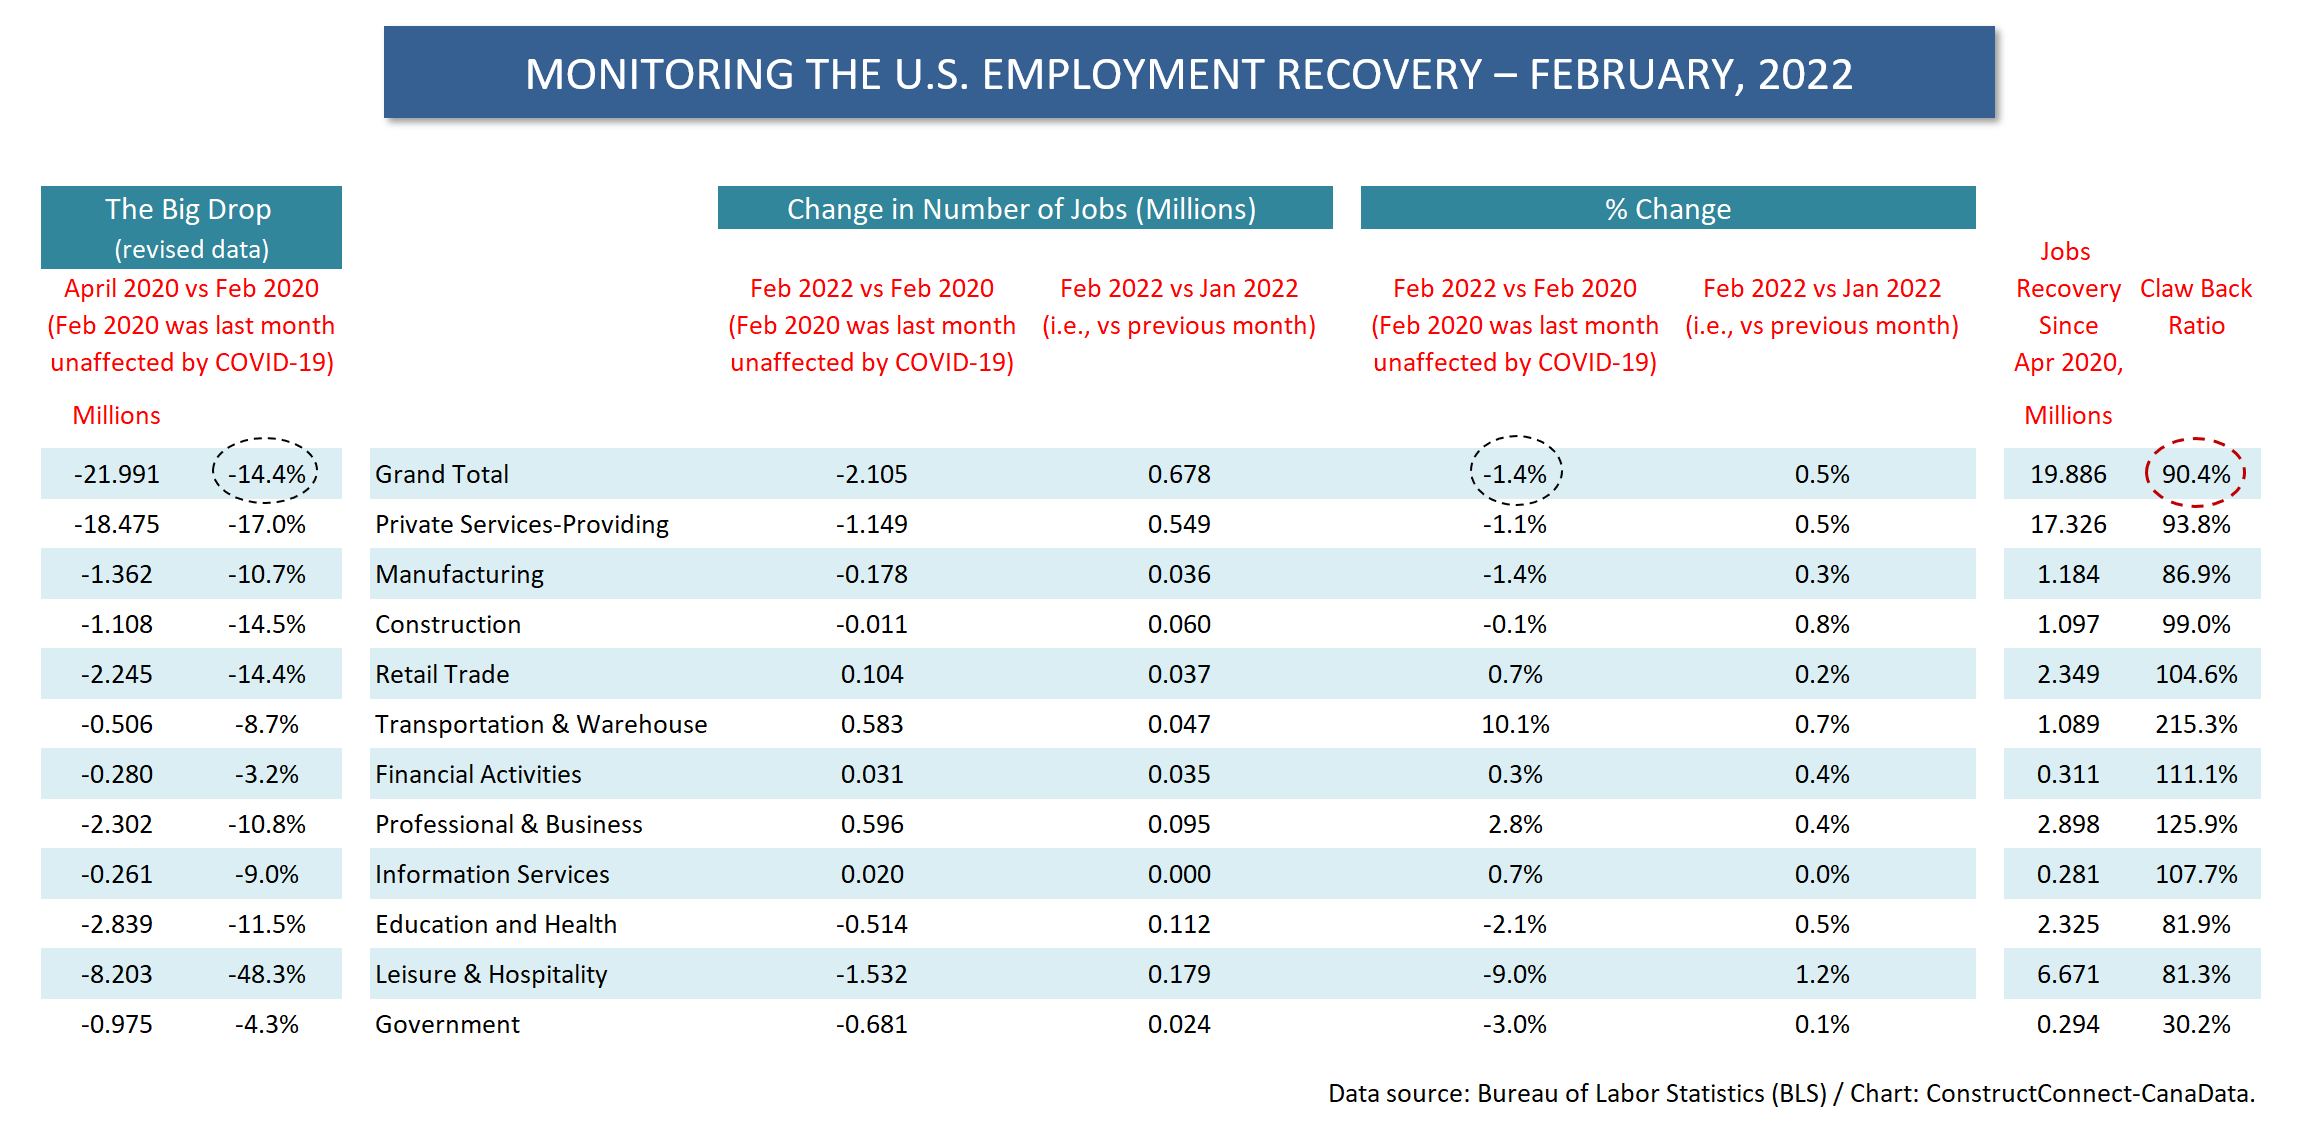
February’s big increase in U.S. total employment lifted the nation’s jobs recover ratio to 90.4%. That’s to say that nine out of every ten jobs that disappeared between February 2020 and April 2020, when the coronavirus first crippled a wide swath of business activity, have now been restored in some fashion.
For the construction sector, the jobs ‘claw-back’ ratio has improved to 99.0%. Total employment in construction is now only -1.0% when compared with its level two year ago, in February 2020, which was the last ‘normal’ month before COVID-19 upended everything.
Table 3
Alex Carrick is Chief Economist for ��������Connect. He has delivered presentations throughout North America on the U.S., Canadian and world construction outlooks. Mr. Carrick has been with the company since 1985. Links to his numerous articles are featured on Twitter��, which has 50,000 followers.


Recent Comments
comments for this post are closed